Changelog
Follow up on the latest improvements and updates.
RSS
We've added powerful customization options to help you create dashboards that tell the right story for your audience.

Drag & Drop Reordering
Organize your pinned questions to create a logical narrative flow. Simply drag and drop cards to rearrange them—perfect for structuring your dashboard from strategic insights at the top to operational details below.
Whether you're preparing for leadership reviews or sharing with different departments, you can now arrange insights in the order that makes the most sense for each audience.
Chart Support in Pinned Questions
Charts now automatically appear in your pinned questions. When a chat response includes a visualization, it will display directly on your dashboard card, making trends and patterns immediately visible.
You can also request charts when creating pinned questions (like "Show me monthly trends as a chart"), and they'll update automatically with each data refresh—giving stakeholders visual insights without opening the chat.
Rename Pinned Questions
Customize pinned question titles for clarity without changing the underlying query. This lets you tailor how insights are presented to different audiences—whether that's executive summaries for leadership or detailed operational titles for your team.
The original question stays intact, so your analysis remains consistent while your presentation adapts to who's viewing the dashboard.
Flexible Card Layouts
Resize pinned question cards to emphasize what matters most. Give more space to critical insights and create a dashboard layout that matches your reporting priorities.
new
Pinned Chats

Pin up to 6 key questions to your agent's dashboard and get answers whenever new data is processed.
Instead of digging through category tables, you'll see the insights you need for reporting right when you open your agent.
Each pinned question appears as a card on your dashboard with a summarized answer. Click any card to see the full conversation in chat where you can explore deeper. Answers update weekly so your reports stay current without manual work.
Your weekly email now includes these pinned questions and their answers, making it easier to share insights with your team.
To get started, open any agent to add your first pinned question and start building your custom reporting dashboard.
We've made significant improvements to help you have more productive conversations with your agents and discover insights faster.
Smart Follow-Up Suggestions

After each response, you'll now see contextual follow-up questions tailored to what you're exploring.
These suggestions fall into three categories:
- Deep diveshelp you investigate specific findings in detail (like "Show Nike trends over last 30 days")
- Breakdown querieslet you segment your data by different dimensions (like "Break down by shipping method")
- Time comparisonsmake it easy to understand changes over different periods (like "Show monthly trends")
The agent automatically adapts suggestions based on your current conversation, so if you're focused on a particular segment or issue, the follow-ups will help you dig deeper into exactly that.
Starter Questions for New Chats

Starting a conversation is now easier with agent-specific suggestions right when you open a new chat. If you have recurring questions, they'll appear as quick-start options.
The agent also generates relevant suggestions based on your agent's goal and available data segments to help you discover new insights.
Chart Visualizations

When you ask for charts or visualizations, the agent can now generate charts to help you see trends and patterns at a glance.
Improved Chat Organization
We've streamlined the chat interface to help you find and manage conversations more efficiently:
- Search now sits at the top of your chat list for faster access
- Conversations are grouped by "this week," "last week," and then by month for easier browsing
- The new chat screen is cleaner, with redundant buttons removed

Stay informed about your customer insights with automated weekly email reports that deliver key findings proactively to your team's inbox.
Email reports automatically share your agent's most important insights and highlights via email on a weekly schedule. These reports help you get insights proactively and share actionable findings with stakeholders who may not regularly access the Lang.ai platform.
Each weekly email report includes highlights with key insights and recommendations, top 5 categories with metrics and trend analysis, ranking changes showing what's moving up or down in priority, and growth metrics indicating volume changes week-over-week.
Note: Email reports require a Snowflake administrator to first create a notification integration. Follow our email integration setup guide or contact your Snowflake admin for assistance.
Want to learn more? Check out our docs for the complete setup guide.

Chat directly with your AI agents using natural language to get targeted answers to specific business questions.
This new chat interface enables data analysts to quickly investigate specific questions without navigating through multiple UI elements. Instead of clicking through tabs and filters to explore data correlations, you can now ask your agent direct questions like:
- Top categories and trendsin your data
- Time-based comparisonsbetween periods
- Customer quotes and feedbackfor specific issues
- Segment-specific analysisacross different customer groups
- Performance metricsand category breakdowns
The chat maintains conversation context, allowing you to ask follow-up questions and build deeper investigations naturally. Each agent includes pre-defined question suggestions to help you get started.
Follow your existing discovery workflow - use the traditional UI to browse highlights and discover patterns, then switch to chat when you need to investigate specific questions or prepare answers for stakeholder meetings.
Want to get started? Open any agent and look for the "Chat with agent" button to begin asking questions about your data.
🧪
Currently in beta:
We're actively expanding query capabilities and would love your feedback on what works well and what could be better.
We now support two distinct analysis modes, giving you the flexibility to analyze your data exactly how your business needs it.
Compare different time periods to see what's changed between them, or analyze a single timeframe to identify emerging patterns and trends within that period.
The Highlights report automatically adapts to show the most relevant insights based on your selected approach.
Access the new date analysis options in the top bar of any agent dashboard.
improved
new
Highlights Report Gets AI Recommendations
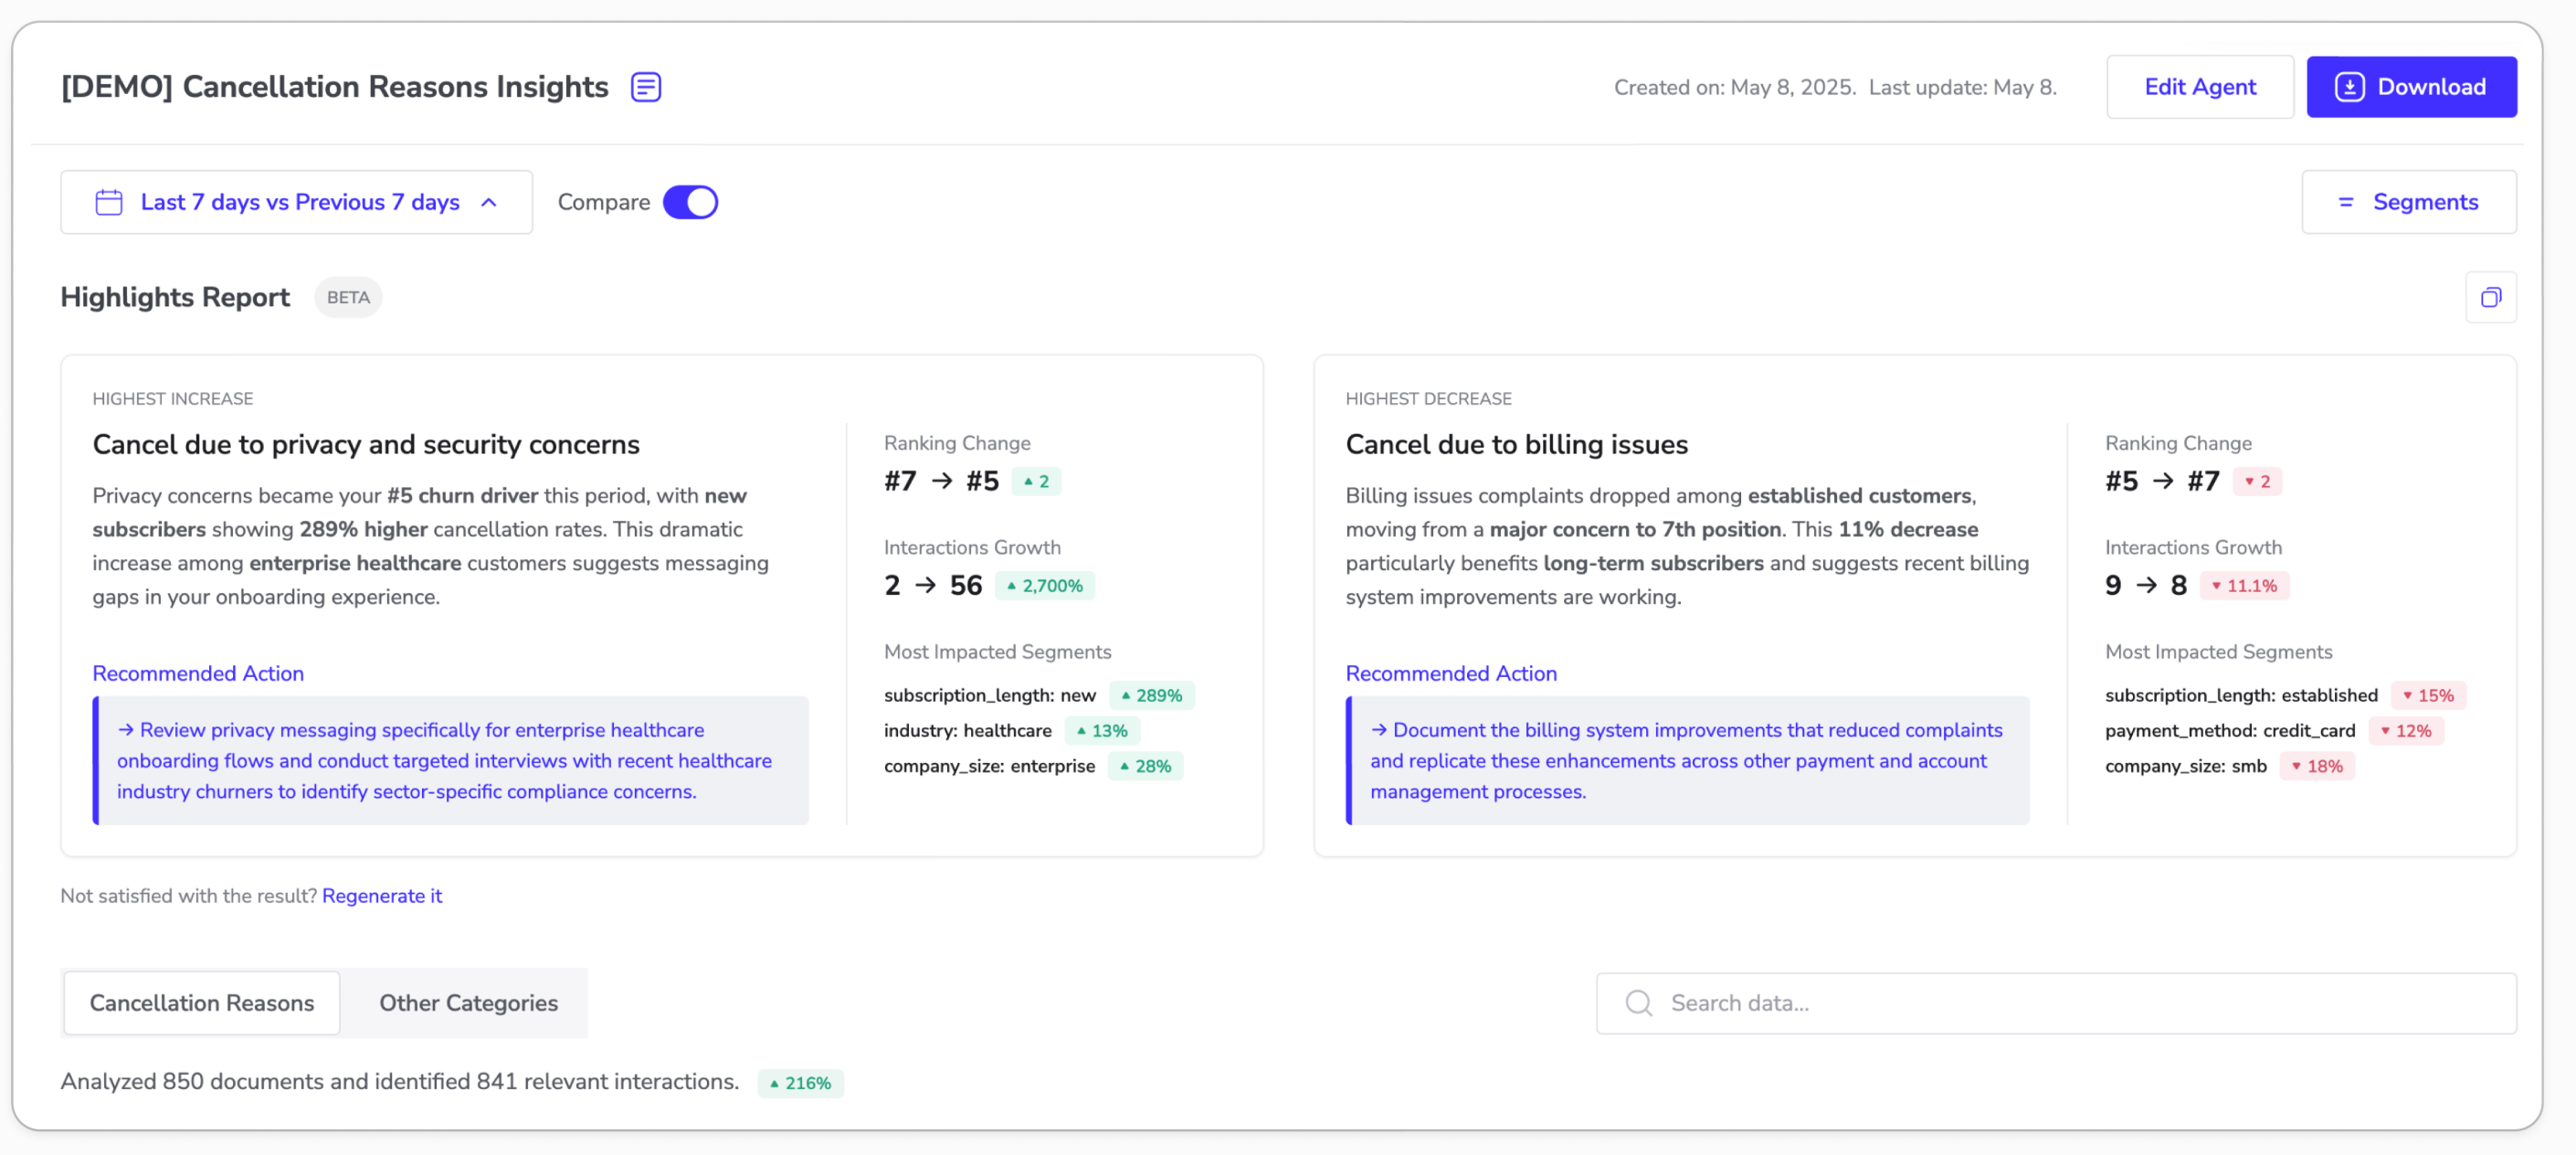
We've redesigned the Highlights Report to transform raw insights into executive-ready business stories with clear next steps.
The new version goes beyond showing what changed to explaining why it matters and what you should do about it. Instead of basic trend data, you now get compelling narratives like "Privacy concerns became your #5 churn driver with new subscribers showing 289% higher cancellation rates among enterprise healthcare customers" followed by specific AI-powered recommendations.
What's New:
- Executive storytellingwith business context and impact
- AI-generated recommendationsfor each significant trend
- Segment insightsshowing which customer groups are most affected
- One-click sharingto easily present findings to stakeholders
- Improved data visualizationwith clearer metrics and ranking changes
Perfect for data analysts who need to confidently present insights to leadership teams. The enhanced report turns complex Snowflake data into actionable business intelligence that drives immediate decision-making.
Each insight now tells a complete story: what changed, which customers are affected, and exactly what your team should do about it.
Find the updated "Highlights Report" in your agent dashboard to start creating compelling data stories.

Get comprehensive understanding of customer issues without reading through raw feedback. The new Insight Summary automatically identifies trends, root causes, and representative quotes.
The summary breaks down topic evolution over time, affected customer segments, and provides actual customer quotes to add context. This helps you quickly understand the full picture behind each insight without manual analysis.
Access Insight Summary by clicking on any insight in your dashboard to see the complete analysis.

Quickly identify emerging issues and trends across your Snowflake data. The new Highlights Report automatically surfaces the most significant changes.
The report shows your highest increasing and decreasing topics, plus changes in metadata distributions like product categories and brands. This helps you spot emerging problems before they escalate and identify what's resonating with customers.
Look for the "Highlights Report" in your dashboard to start tracking customer feedback trends.

Your preferred date ranges now persist between sessions, with preset options like "Last 7 days" available for faster reporting.
Date filters automatically apply when you reopen the app.
Load More
→